“Do you know how long it took for us to be here and organise this event? It took 500 days to go from an idea to an actual event being held here in Palo Alto Club with all of you!” said Andres Kukke, the Deputy Director General of Information Technology of Statistics Estonia.
So, after 500 days, almost 90 participants gathered from the 9th to 10th May to tell a story through good visualisation, which meant removing the noise from data and highlighting the useful information. After presenting the challenges that Statistics Estonia had prepared and 7 ideas pitched by the participants, 13 teams were formed. All of them started to work super hard in order to transform the boring rows in Excel into beautiful and eye-catching visualisations that could (and will) help the Statistics Estonia to improve the way people see and understand data.
Annika Brauer, who is the Head of Data Technology Department at Statistics Estonia and one of the main organisers from Statistics Estonia side said that the hackathon was a great success. “It was so motivating to see how 13 teams in 24 hours managed to work on solutions that were really clearly and innovatively visualising the data.” She added that these solutions will definitely go into use.
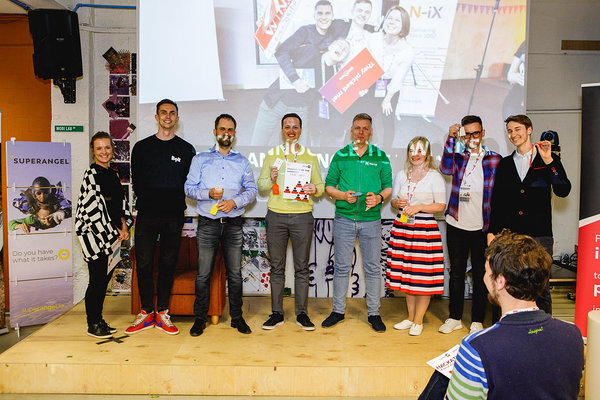
After intense 24 hours, these are the teams that made the cut for the podium:
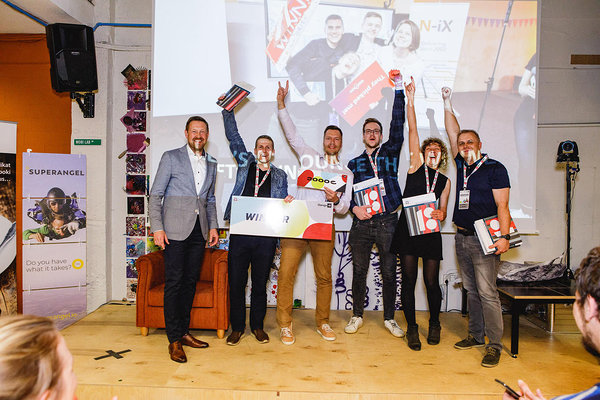
WINNERS - NetGroup and their idea Future Teller which is a software tool for easy modelling of countries’ future that would reduce cost and improve the efficiency of government decision-making through great visualisation and machine learning.
Team NetGroup celebrating yet another successful hackathon. The award - 3000€ - was presented to them by Mart Mägi, the director general of Statistics Estonia.
1st RUNNER UP - 100 Estonians who turned data into a gamification experience. They took actual population data and statistics and presented it in a fun and relatable way.
2nd RUNNER UP - minust.ee team created a tool that takes basic data (date of birth, sex, education, location etc.) and calculates your statistical life expectancy (and other relevant metrics).
FAVOURITE OF THE AUDIENCE - Racing Charts which is a web platform where young people can choose a topic that interests them and get a relevant and proper info about that.
But like we always say in Garage48, everybody who comes and survives a hackathon is already a winner.
Huge thank you goes out to all the participants, the Statistics Estonia team and mentors, our host Karin Sarv from Mooncascade, sponsors and the always wonderful Garage48 mentors - Andreas Roosson, Martin Verrev, Helen Kokk, David Felipe Castillo.
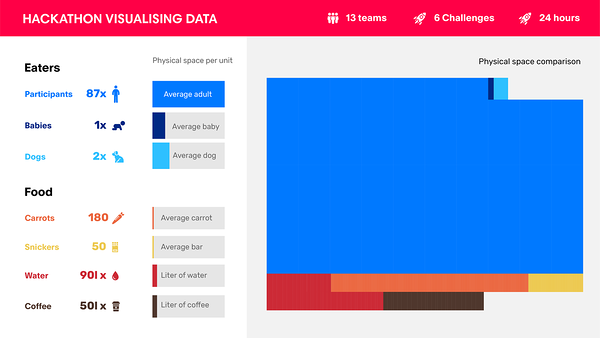
Our belowed mentor David Felipe Castillo visualised the data connected to the hackathon.
