Garage48 Visualising Data

When 9-10 May 2019

Where Palo Alto Club, Tallinn

  • Overview
  • Agenda
  • Get Ready
  • Challenges
  • Have you ever stared at a massive spreadsheet of data and thought how much prettier it would look when visualised? Does your mind instantly wanders to diagrams, charts and graphs or do you prefer to bring data alive through animation and movement?


    The art of making data beautiful and sexy is taking the world by storm. Data and data analysis have taken on a new quality and what used to be simple charts are now complex and creative pieces of data art. A good visualisation tells a narrative, removing the noise from data and highlighting the useful information - it’s a storytelling with a purpose.


    HOW DOES IT ALL WORK?

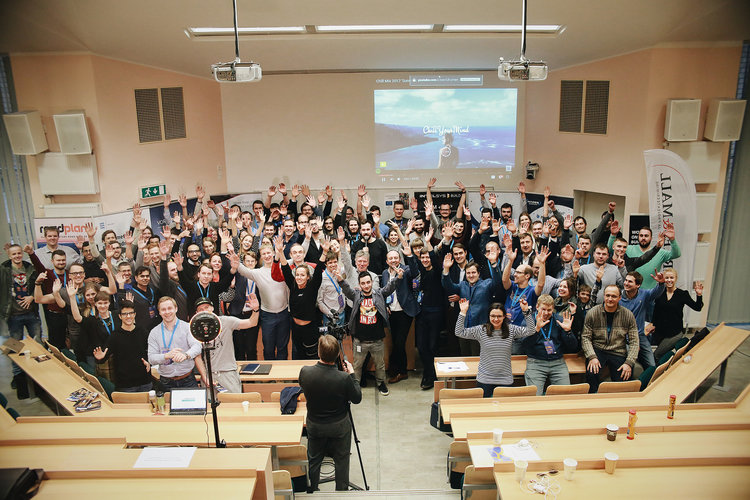
    We start on Thursday, 9th of May at 15:30 with registration. At 16:00 we kick off with the event, lead by Karin Sarv - our wonderful host from Mooncascade! Friday, 10th of May at 17:00 is the time to show your work and win some amazing prizes. Check the AGENDA tab on our website for more thorough plan for the 24 hours.


    Statistics Estonia has prepared a selection of tasks and data which you can open here: https://gitlab.com/statistics-estonia/hackaton-2019-visualising-data/hackaton-info


    All different approaches and visualisations are welcomed and even expected (front-end code, for example static javascript files, animated codes, videos). Let the most colourful idea win! You will have 90 seconds to present your idea to the crowd. Teams will be formed on the spot around the best and brightest solutions.  

    After the event Statistics Estonia would like to access the codes of the solutions, so they expect the
    teams to publish the codes in a public repository, which is accessible for everyone. They are also providing a public GitLab account in case you don’t have an option to upload your work yourself. All the visualisations will be added to a public library for everyone to see by Statistics Estonia.


    WHO’S INVITED TO JOIN?

    Garage48 and Statistics Estonia are inviting: 

    - designers,

    - front end developers,

    - data scientists/enthusiasts,

    - business masterminds/project managers (to coordinate the work of the teams),

    - movie makers and artists to tell a story through a good visualisation. Come and help to transform the boring rows in Excel into a beautiful and eye-catching visualisations that will help the Statistics Estonia to carry out the future projects that will change Estonia and the way we look at data.


    VENUE, FOOD AND DRINKS

    Visualising Data Hackathon will be held in one the most vibrant blocks in Tallinn - Palo Alto Club in Telliskivi Creative City. We don’t want you to worry about food and drinks and snacks. We got you covered. You just focus on making data sexy!


    Join us and let’s make data great again!


    Join the event in Facebook!

    Get your tickets HERE!  


    Thursday, 9th of May 
    15:30 Registration, coffee and snacks 
    16:00 Opening remarks by G48 host and Statistics Estonia  
    16:30 Presenting / pitching the ideas and challenges
    18:00 Team formation
    18:30 Team work begins
    21:00 Pitch training

    Friday, 10th of May 
    09:00 Breakfast 
    10:00 Checkpoint #1
    11:15 Team work continues 
    13:00 Lunch 
    13:30 Team work continues 
    15:00 Pitch drill with the demo
    17:00 Light snacks and coffee 
    17:30 Final presentations
    19:00 Award ceremony and networking

    WHAT TO BRING WITH YOU?

    Positive attitude, an open mind and lots of energy! Be open, get to know new people, share your ideas and give ideas/feedback to other teams. MOST IMPORTANT - have fun!

    Please take your:
    1) Laptop 
    2) 3-5m power extension cord (as power might be at a distance)
    3) All chargers
    4) Water bottle and thermos (help us reduce the use of plastic in this event) 

    PITCHING IDEAS

    Statistics Estonia will present their challenges and database to all the participants.

    If participants have their own ideas, they should present their ideas based on "elevator-pitch" method within 90 seconds. You can prepare 1 PDF slide to support your pitch. You should send the slide by Wednesday, 8th of May 19.00, to merit@garage48.org. 

    TEAM FORMATION
    The average team will have 4 to 6 people. The team should be balanced which means that all required roles should be covered - designer, front end developer, data scientist/data analyst/ data enthusiast, project manager. This is essential in order to get the product/service ready in 24 hours. 

    After Statistics Estonia has presented their challenges and participants with their own ideas have pitched, the teams will be formed and work starts. 
    Datasets can be found in Statistics Estonia database in English and Estonian, here:
    • http://andmebaas.stat.ee/?lang=et
    • http://andmebaas.stat.ee/?lang=en
    Just copy-paste the table numbers (indicated near the challenges) and you’ll find the data.

    NB! Data that is connected to challenges nr.5 and nr.6 can be found here: https://gitlab.com/statistics-estonia/hackaton-2019-visualising-data/hackaton-info (MFA data.xlsx and Youth_in_Estonia.xlsx)

    We suggest the solutions to be built around the personalised approach of an individual or an enterprise – how I’m personally related to the dataset, or how is my enterprise doing?

    1. POPULATION

    1.1 Population pyramids by local municipalities and counties, by years
    (Source: dotStat database table RV0241 (years 2012-2017 – place of recidence before 2017 administrative reform) and RV0240 (years 2015-2019 - place of recidence after 2017 administrative reform))

    1.2 Population projections – a tool for user to forecast Estonian population by year x. 
    • User could input some values to see what happens with the forecast: total fertility rate, mortality, net migration, etc.
    (Source: dotStat database: RV0212 – population by sex and age beginning of the year or RV021 – population by sex and age groups)

    1.3 Migration count and distribution by local municipalities and counties – Where do people
    settle and where do they leave from? 
    (Source: dotStat databases: RVR02)

    1.4 Population clock – animated increase/decrease of Estonian population by
    minutes/days/months/years
    (Source: dotStat database tables RV0213 ja RV0213U)

    1.5 How long do I live? (Source: dotStat databases RV045 – life expectancy by sex and age,
    RV0451, RV0452, RV0453, RV0454 – life expectancy in different breakdowns)

    1.6 Statistics about date (day, month, year) – a tool for user to see information about inserted
    date:

    •  How many people (boys and girls) celebrate their birthday on this day in Estonia?
    (Source: Data in Excel: Birthdays 2019.xlsx)

    •  How many people born in this month/year? (Source: dotStat database RV10)
    •  How many people born in this year by county? (Source: dotStat database RV11, RV112,
    RV112U)
    •  What is the life expectancy for this date? (Source: dotStat database RV045)

    2. LABOUR MARKET

    2.1 Labour force analysis – labour tree or other tool to describe distribution of population aged
    15-74 by labour status (number of people and rates), or by years with the possibility to
    change age groups.

    Source: Yearly data: TT331, TT220, TT217, TT43, TT451. Quarterly data: TT461, TT478,
    TT477, TT441, TT452
    Supporting schemas: https://www.stat.ee/dokumendid/1518883 and
    https://www.stat.ee/dokumendid/37136

    2.2 Which profession to choose: employed persons by age group, sex, economic activity, major
    group of occupations
    (Source data tables: TT0201, TT0202, TT2129 or any other section in
    Employed persons’ annual statistics)

    3. SALARIES IN ESTONIA

    3.1 Average gross wages (salaries) based on monthly quarterly and annual data Source: PA006,
    PA001
    • Where do I stand in salaries pyramid?

    3.2 Average gross wages (salaries) Source: PA001, PA003, PA005, PA22, PA5335
    • Where to get more salary? – by economic activity, economic activity section, type of
    owner of an economic unit, county, gender

    3.3 Gender pay gap (GPG) by economic activity PA5335
    • How big is the GPG in the field I work at?

    4. ESTONIAN ENTERPRISES AND ENTERPRISE DEMOGRAPHY

    4.1 Active Estonian enterprises:
    • by administrative units (whether by local municipalities or counties) and
    • by economic activity
    • How has the distribution changed over the years?
    • How an administrative reform in 2017 affected distribution by counties?
    NB! Due to administrative reform the time series presented in two tables.
    Source: dotStat database tables: 2000-2017y table RE031, 2017-2018y table RE0309. Please note
    that 2017y data is doubled for both database table.

    4.2 Active Estonian enterprises:
    • by administrative units (whether by local municipalities or counties) and
    • by number of employees
    • How has the distribution changed over the years?
    • How an administrative reform in 2017 affected distribution by counties?
    NB! Due to administrative reform the time series presented in two tables.
    Source dotStat database tables: 2000-2017y table RE32, 2017-2018y table RE032. 2017y is doubled
    for both database table.

    4.3 Active Estonian enterprises:
    • by economic activity and
    • by legal form
    • How has the distribution changed over the years?
    Source dotStat database table: RE029

    4.4 Active Estonian enterprises:
    • by economic activity and
    • by type of owner
    • How has the distribution changed over the years?
    Source dotStat database table: RE026

    4.5 Active Estonian enterprises:
    • by economic activity and
    •  by number of employees
    •  How has the distribution changed over the years?
    Source dotStat database table: RE025

    4.6 Active, born and dead enterprises:
    •  by counties and
    •  by economic activity and
    •  by number of employees
    •  How has the distribution changed over the years?
    •  How has the survival rate (proportion of the born enterprises in active enterprises) changed
    over the years?
    •  How has the deaths rate (proportion of the death enterprises in active enterprises) changed
    over the years?
    Source dotStat database tables: RE051, RE052, RE053

    4.7 Survived enterprises:
    •  by year of birth
    •  by number of employees
    •  by economic activity
    •  by counties
    •  Which enterprises are more viable during 5 first years of their life?
    Source dotStat database table: RE060

    5. ECONOMY-WIDE MATERIAL FLOW ACCOUNTS (EW-MFA)

    Economy-wide material flow accounts (EW-MFA) are a statistical accounting framework describing
    the physical interaction of the economy with the natural environment and the rest of the world economy
    in terms of flows of material.

    How to visualize the data on the flows of material resource? How Estonia pops up among other
    countries of EU?

    5.1. Material Flow Accounts is providing important information and statistical indicators on
    material use: how much and what kind of materials are extracted, are these materials used by
    national economy itself or are mostly exported?

    Main datasets : Statistics Estonia database tables EN91, EN957. In case you use attached
    “MFA_data.xlsx”, Estonian data are on sheet: “Domestic extraction” and “Exports - physical
    units”, for other countries data, international data for EU Member Countries are available
    in Eurostat database: https://ec.europa.eu/eurostat/data/database under the following category:
    Environment and energy -> Environment -> Material flows and resource productivity->
    Material flow accounts. (env_ac_mfa)

    5.2. What kinds of materials are imported, what is the balance between export and import of
    materials?

    Dataset: Statistics Estonia database tables EN956, EN957, EN958. In case you use attached
    “MFA_data.xlsx”, Estonia’s data are on a sheet:” Imports - physical units”. For trade balance
    there is also sheet “Exports - physical units”, data for EU Member Countries are available
    in Eurostat: https://ec.europa.eu/eurostat/data/database under the following category:
    Environment and energy -> Environment -> Material flows and resource productivity->
    Material flow accounts. (env_ac_mfa)

    5.3. How efficiently materials are used? What is resource productivity (how much of GDP is
    generated per one ton used material)? How Estonian economy is doing compared to other EU
    members from point of view of material use or generation of residues?

    Dataset: Statistics Estonia database table EN99. In case you use attached “MFA_data.xlsx”,
    Estonia’s calculated indicators are on a sheet named ”Indicators publ-d by STAT EE”. Data
    for EU Member Countries are available in Eurostat:
    https://ec.europa.eu/eurostat/data/database under the following category: Environment and
    energy -> Environment -> Material flows and resource productivity-> Resource
    productivity:(env_ac_rp)

    Supporting datasets:
    Population figures: Statistics Estonia database tables PO0211 (population data). Data for EU
    Member Countries are available in Eurostat database:

    https://ec.europa.eu/eurostat/data/database under the following category: >Population and
    social condition ->Demography and migration -> Population change - Demographic balance
    and crude rates at national level ->average population total (demo_gind)

    GDP - NAA0061: Gross domestic product by expenditure approach (ESA 2010) - gross
    domestic product at market prices and chain-linked volumes (2010), million euros
    International data for EU Member Countries are available in Eurostat database:
    https://ec.europa.eu/eurostat/data/database under the following category: >Economy and
    finance->National accounts (ESA 2010)-> Annual national accounts-> main GDP aggregates-
    > GDP and main components (output, expenditure and income) (nama_10_gdp)-> gross
    domestic product at market prices and chain-linked volumes (2010), million euros

    The attached Excel sheets (MFA_data.xlsx) contain material flow accounts data tables
    which Estonian Statistics provide to Eurostat. The sheet Estonian indicators contain calculated
    material flow main indicators (published), population figures and gross domestic products
    (which have been used for indicator calculation). Attached word file contains data description
    and definitions. International data for EU Member Countries are available in Eurostat
    database: https://ec.europa.eu/eurostat/data/database under the following cathegory:
    Environment and energy -> Environment -> Material flows and resource productivity.

    6. YOUTH CONDITIONS IN ESTONIA

    (Source: Data in Excel: Youth_in_Estonia.xlsx)
    6.1 How to present youth data in a playful way – from youth to youth? How can statistics draw
    young people’s attention?


    6.2 How can young people compare themselves to one another? Which parameters could be
    used for comparing regional differences
    (e.g. my municipality against the whole country/my
    county/other municipalities in Estonia or in our neighbourhood)?

    6.3 How can young people check their knowledge about youth statistics? Which municipalities
    have the largest proportion of young people, most young entrepreneurs, most hobby
    schools, etc?


    6.4 How to present regional youth data to show the diversity? Map is always a good way. What
    other methods do we have to express data localisation?

    WHAT IS SAID

    #G48TALLINN #G48VISUALISINGDATA

    THE SUPERSTARS
    The Mentors 

    Karin Kirmjõe
    Software Product Manager at Mooncascade
    Andreas Roosson
    Graphic Designer at Hmmm Creative Studio
    Helen Kokk
    Design Product Lead
    Martin Verrev
    Creative Engineer at Littlebit and lecturer at TalTech
    Kaia Oras
    Leading analyst, Team-leader of Environment Statistics and Accounts at Statistics Estonia 
    Epp Karus
    Head of Department at Statistics Estonia
    Eve Telpt
    Leading analyst at Statistics Estonia
    Heidy Roosimägi
    Head of Population and Social Statistics Department at Statistics Estonia
    Ethel Maasing
    Leading analyst at Statistics Estonia 
    David Castillo
    Designer at Veriff

    Organizers

    Merit Vislapu
    Project Manager at Garage48
    Helena Eglit
    Volunteer at Garage48

    The Programme is brought to you by: